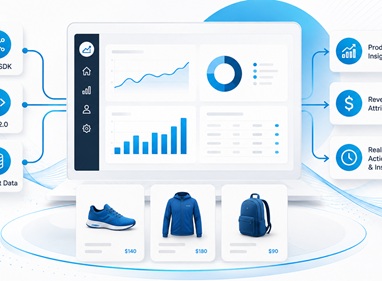
Your Adobe Analytics dashboard can tell you what happened. The more interesting question is what happened after. That distinction sits underneath several of Adobe's August 2026 updates. Across Adobe Analytics, Customer Journey Analytics and Adobe Experience Platform, Adobe is giving teams more ways to explore what happens later in a journey, connect people to B2B accounts, expand content measurement and move audiences toward activation.
Individually, these look like product enhancements. Together, they suggest a bigger shift: Analytics is getting closer to the moment when a MarTech insight can actually be used
The key Adobe Analytics August 2026 updates include Journey Canvas enhancements, an Activity Map interface refresh and new Analytics 2.0 API resources. Customer Journey Analytics added B2B person-to-account stitching and paid media in Content Analytics, while Adobe Experience Platform introduced on-demand audience evaluation.
The common thread is more context around customer signals — and fewer steps between understanding a behavior and deciding what to do next.
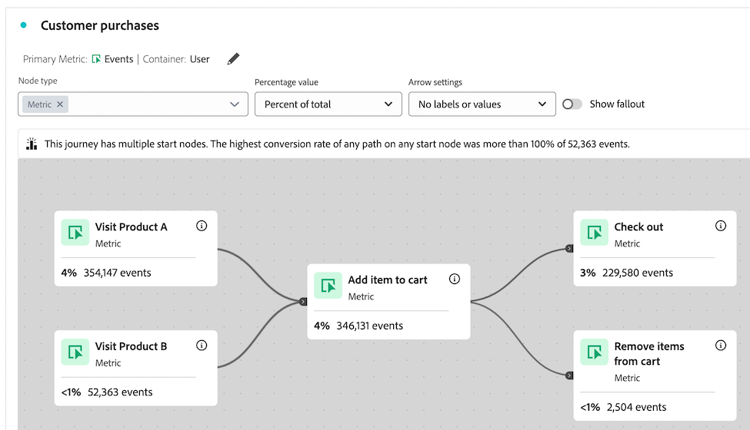
Journey Canvas received one of the most useful MarTech updates in August. Analysts can now compare journeys with an earlier period — including four weeks earlier, two quarters earlier, one year earlier or a custom date range. They can also examine dimension items occurring at any point after a selected node, rather than only looking at the immediate next step.
Why does that matter? Because real customer journeys are rarely linear.
Page A → Page B → Conversion
They look more like:
Signal → leave → return → research → another channel → hesitation → action
The new capability makes it easier to investigate what happens after the important moment, not simply what happens immediately afterward.
That changes the question:

That is where a dashboard starts becoming a tool for investigation rather than just reporting.
Here’s a quick look at the key August 2026 updates and what they mean for analytics teams.
What looks like a simple journey is often anything but;

The individual releases become more interesting when viewed as a progression:
SEE → UNDERSTAND → CONNECT → ACT
Activity Map and Journey Canvas help teams see meaningful signals and investigate what happens around them. Journey comparison adds context, helping teams understand whether behavior is changing. B2B stitching and broader Content Analytics help connect people, accounts, content and channels. On-demand audience evaluation moves selected workflows closer to action.
The common thread is simple: more context around customer behavior and a shorter path from signal to action.
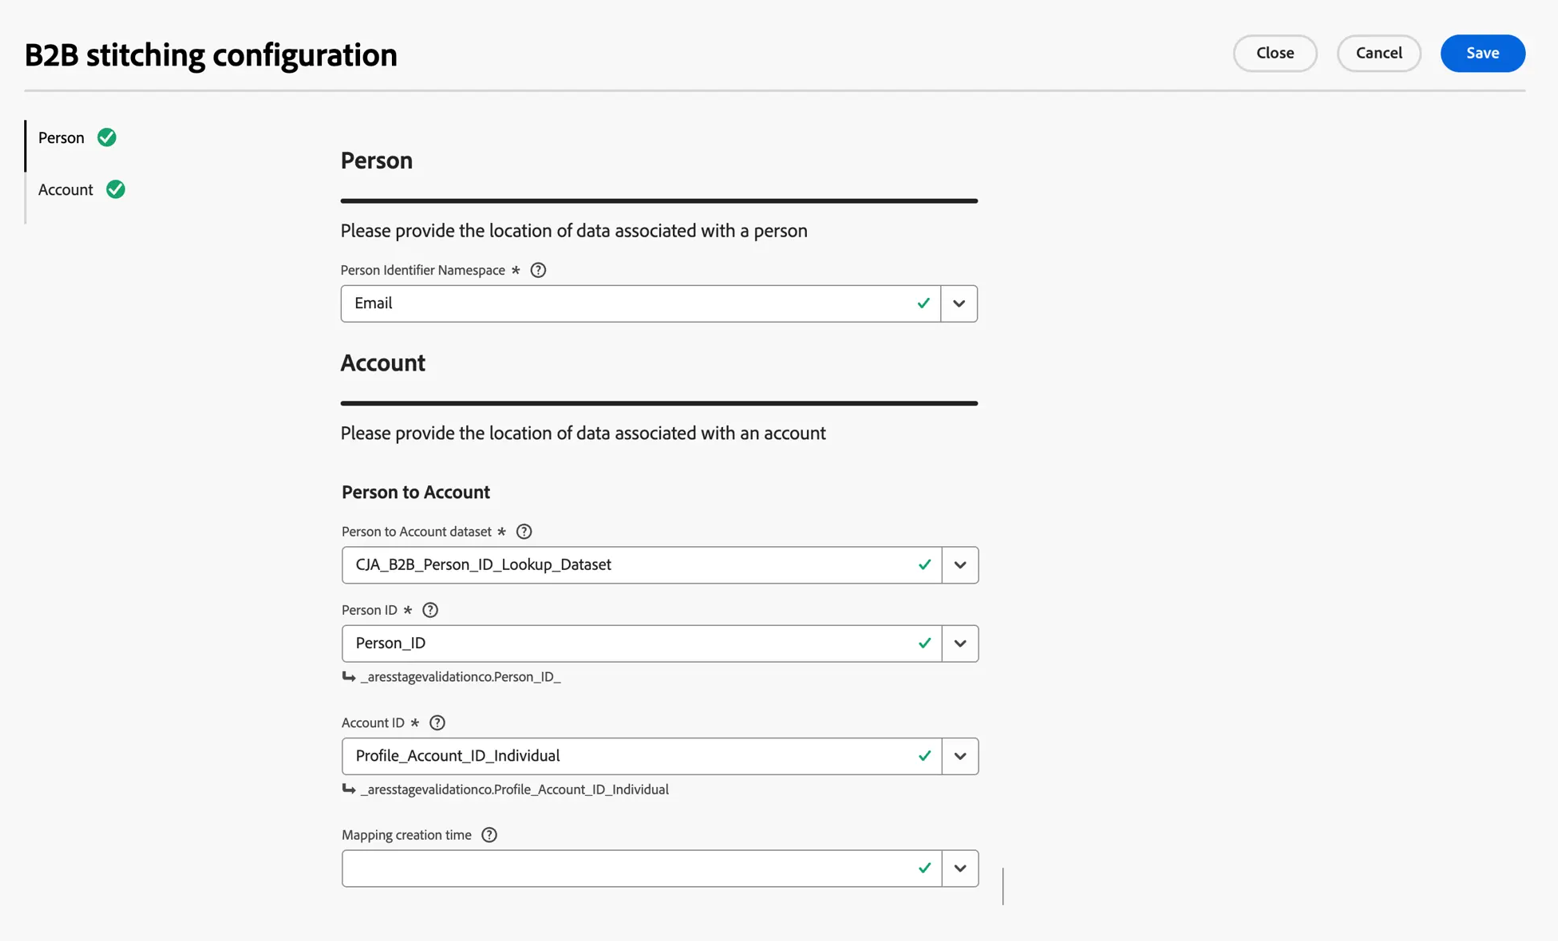
One of the quieter Customer Journey Analytics updates could have a major impact on B2B analysis. Adobe introduced person-to-account stitching, which can associate events missing an account ID with the appropriate account using an organization-provided mapping dataset.
Consider a typical B2B journey. One employee downloads a report. Another attends a webinar. A third visits pricing. Meanwhile, sales is already talking with the company. Viewed separately, these interactions look fragmented.
Viewed at the account level, they may reveal a much stronger pattern.
The question changes to:
That is a fundamental difference in how customer journey data can support B2B decision-making.
Customer Journey Analytics also added paid media as a third channel for Content Analytics. That matters because content rarely operates inside one channel. A piece of content may be discovered organically, promoted through paid media, shared elsewhere and eventually influence a conversion.
Adding paid media gives teams another way to understand where content creates movement across the customer journey.
The same pattern appears in Adobe Experience Platform. August introduced on-demand audience evaluation, allowing teams to trigger evaluation for a specific audience rather than waiting for its scheduled evaluation. Adobe also introduced a private-beta capability for resending current audience membership to certain streaming destinations on demand. There is a meaningful difference between:
“The audience will refresh later.” and: “The audience can be evaluated now.”
Experience Platform also introduced dataset-level access controls. That combination matters. Faster activation without appropriate governance creates risk. Better governance without usable activation creates friction. The value is in bringing the two closer together.
Marketing leaders should look for delays between customer signals and marketing decisions.
Analytics teams should examine whether journey and account context can improve how behavioral questions are investigated.
MarTech and development teams should consider the implications for APIs, identity, audience operations, integrations and governance.
And there is a practical question underneath all of it:

Journey analysis depends on reliable event data. B2B stitching depends on identity and account relationships. Audience activation depends on usable segments and destinations. Governance depends on knowing which data can be accessed and by whom.
A more powerful analytics stack does not automatically produce better MarTech insights. The quality of the connections underneath it still matters.
TSB provides a useful example.
Using Adobe Customer Journey Analytics and related Adobe Experience Platform capabilities, TSB reduced data latency from nine days to less than 24 hours, with many signals available instantly. One use case involves customers who start but do not complete a mortgage application, allowing TSB to respond with a tailored message while they are still in the journey.
Adobe reports that this real-time approach contributed to a 50% increase in customers choosing TSB. This is an Adobe-reported customer result, not a general benchmark. The lesson: Faster data doesn’t just improve reporting. It changes what a business can do with an insight.
For a deeper look at turning analytics into decisions and action, see Devrun's Actionable Insights.
Looking at the August releases individually misses the larger story. The direction looks more like:
See the signal → understand the journey → connect the context → decide → activate.
The technology does not eliminate the need for clean data, strong identity design, governance or thoughtful implementation. But it can reduce the distance between the moment something meaningful happens in the data and the moment someone can respond.
The next generation of analytics won't be defined by how much data teams can see, but by how quickly they can do something meaningful with it. That may be the most important takeaway from the Adobe Analytics August 2026 updates. Not another dashboard. A shorter path from insight to action.

The key updates include Journey Canvas enhancements, an Activity Map refresh and new Analytics 2.0 API resources. Customer Journey Analytics also introduced B2B person-to-account stitching and paid media in Content Analytics.
August updates include person-to-account stitching for B2B analysis, paid media in Content Analytics and enhanced journey analysis capabilities.
It connects event activity to the appropriate B2B account when an event does not contain the required account ID, using an organization-provided mapping dataset.
They provide more journey context, stronger account-level analysis, broader content measurement and faster audience evaluation — helping teams move from an observed signal toward a business action more efficiently.