
A marketing director opens Google Analytics and sees something that immediately catches attention. Conversions are down, not dramatically enough to trigger an alert, but enough to make the number uncomfortable. The first instinct is familiar: check traffic. Then channels. Then campaigns. Then landing pages. Then the form. Ten minutes later, the dashboard has produced plenty of information but still has not answered the only question that matters:

That is the problem Google is trying to address with the new GA4 Dashboards released on September 9 2026. Dashboards bring key KPIs and visualizations into a single customizable report, with a grid-based interface, drag-and-drop creation and several visualization types including scorecards, tables, line charts, bar charts, donut charts and funnels.
On the surface, it looks like a reporting improvement. For marketing teams, it can become something more useful: a shorter path between noticing a change and investigating it.
A dashboard can tell a team that revenue is falling. It can show that paid traffic is increasing while conversion rate is declining. It can reveal that one campaign has suddenly become responsible for a larger share of sessions. What it cannot automatically tell the team is whether the problem is demand, traffic quality, campaign configuration, website performance, consent, tracking or something as simple as a broken form.
That distinction matters because analytics has never really suffered from a lack of numbers. The harder problem is turning numbers into decisions quickly enough for the decision to still matter. Forrester found in 2026 that 49% of B2C marketing decision-makers say analytics findings do not translate into action. The same research points to the time required to turn insights into marketing plans as one of the reasons value can disappear before the organization acts.
For a marketing organization, that changes the role of a dashboard. The dashboard should not be treated as the strategy. It should be the place where a reliable measurement system makes an important business signal visible early enough to investigate.
Consider that Monday morning conversion declines again. A useful dashboard would not stop at a single conversion KPI. It would give the marketer enough surrounding context to move through the investigation without rebuilding the analysis from scratch.
The technical layer is important because the same visual decline can have completely different causes. If generate_lead suddenly falls by 28%, for example, the dashboard may correctly report the decline while remaining completely silent about why it happened. The next investigation could involve traffic quality, a campaign ending, a landing-page change, a form failure, an event implementation problem or a consent configuration change.
For example, if conversions fall by 28%, start by comparing the key event across device, landing page, channel and campaign. If the decline appears only on mobile, validate the event implementation on mobile. If it appears only for one campaign, check its UTM parameters and campaign data. If event volume changes without a similar change in traffic, review the implementation, parameters and consent signals before assuming that customer behavior changed.
A structured investigation helps narrow the cause quickly. Start with the GA4 signal, then move into the dimensions and technical checks that can explain the change.
That is why the quality of the measurement architecture underneath the dashboard matters as much as the dashboard itself.
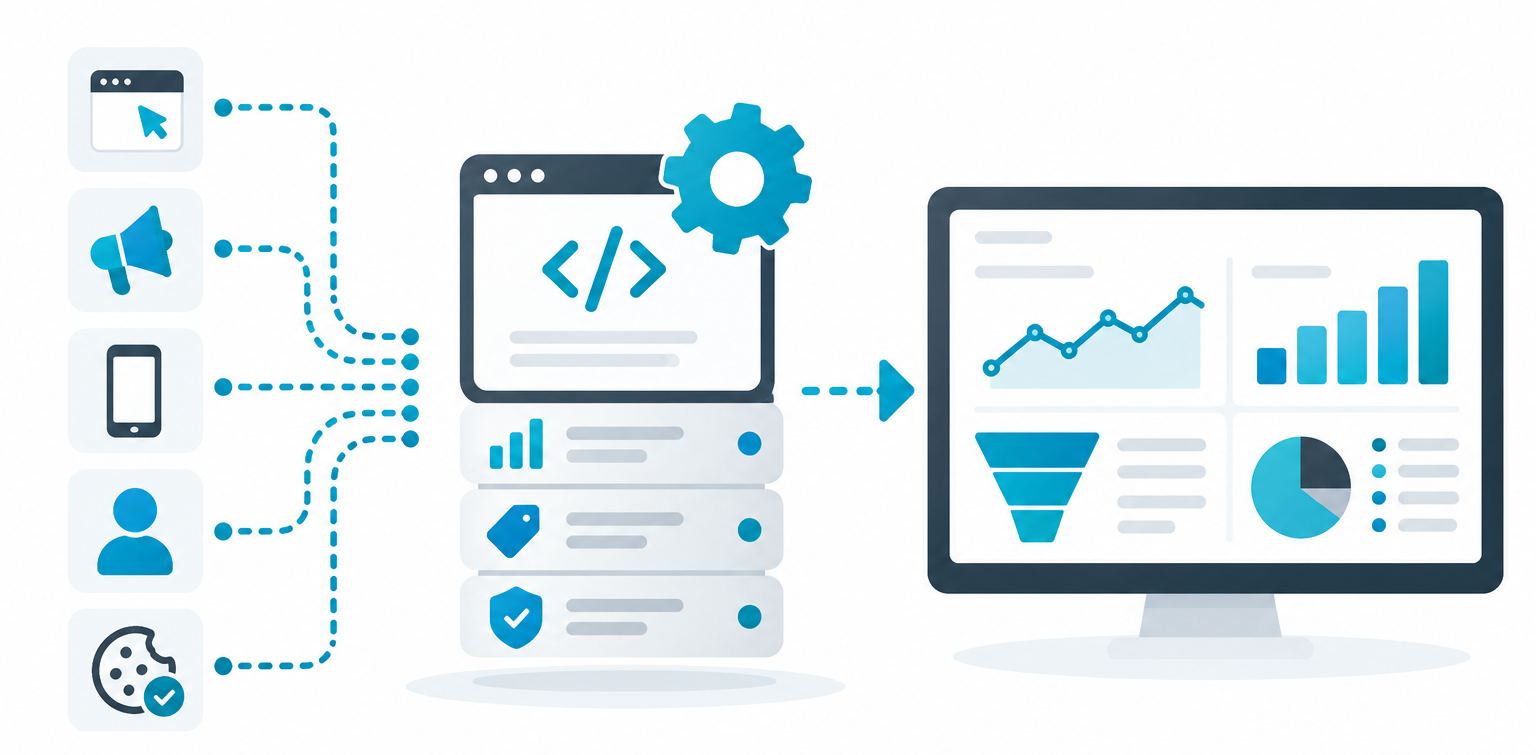
GA4 dashboards are only as reliable as the events, parameters, key events, and campaign data behind them. This matters even more as Google moves toward automated analysis with properties.chat, allowing natural-language questions and structured responses from GA4 data. This becomes even more important when different teams rely on dashboards built from different definitions and data sources.
The interface is no longer limited to clicking through predefined reports. A developer could potentially build an internal analytics workflow that asks GA4 a question, receives a structured response and passes that information into another business process. But Google explicitly warns that the AI-powered feature may produce inaccurate information. That warning is not a footnote to ignore. It reinforces a broader principle: natural-language analytics makes access to data easier, but it does not remove the need for trustworthy data, governance and human validation.
According to Forrester, nearly half of B2C marketing decision makers in 2026 struggle to turn analytics findings into action, highlighting the growing gap between measurement and execution.
A simple validation sequence can prevent hours of investigation. First, confirm that the event is firing. Then check that it fires once, that its parameters are populated consistently, and that the event is classified correctly as a key event. Finally, compare the result across devices, landing pages and campaigns. This creates a direct path from a business question to a technical validation.

Marketing organizations are adding more technology while simultaneously being asked to prove more value from it. Gartner reported that CMOs allocated an average 15.3% of marketing budgets to AI in 2026, while only 30% reported that their organizations had mature or fully developed AI readiness. Gartner also found that 56% of surveyed CMOs said their marketing organizations lacked the budget required to execute their 2026 strategy.
That combination creates an interesting pressure point for analytics teams. More AI does not automatically create better decisions. More dashboards do not automatically create better decisions either. The organization still needs to know which business questions matter, whether the underlying data can answer them and what action should follow when a meaningful change appears.
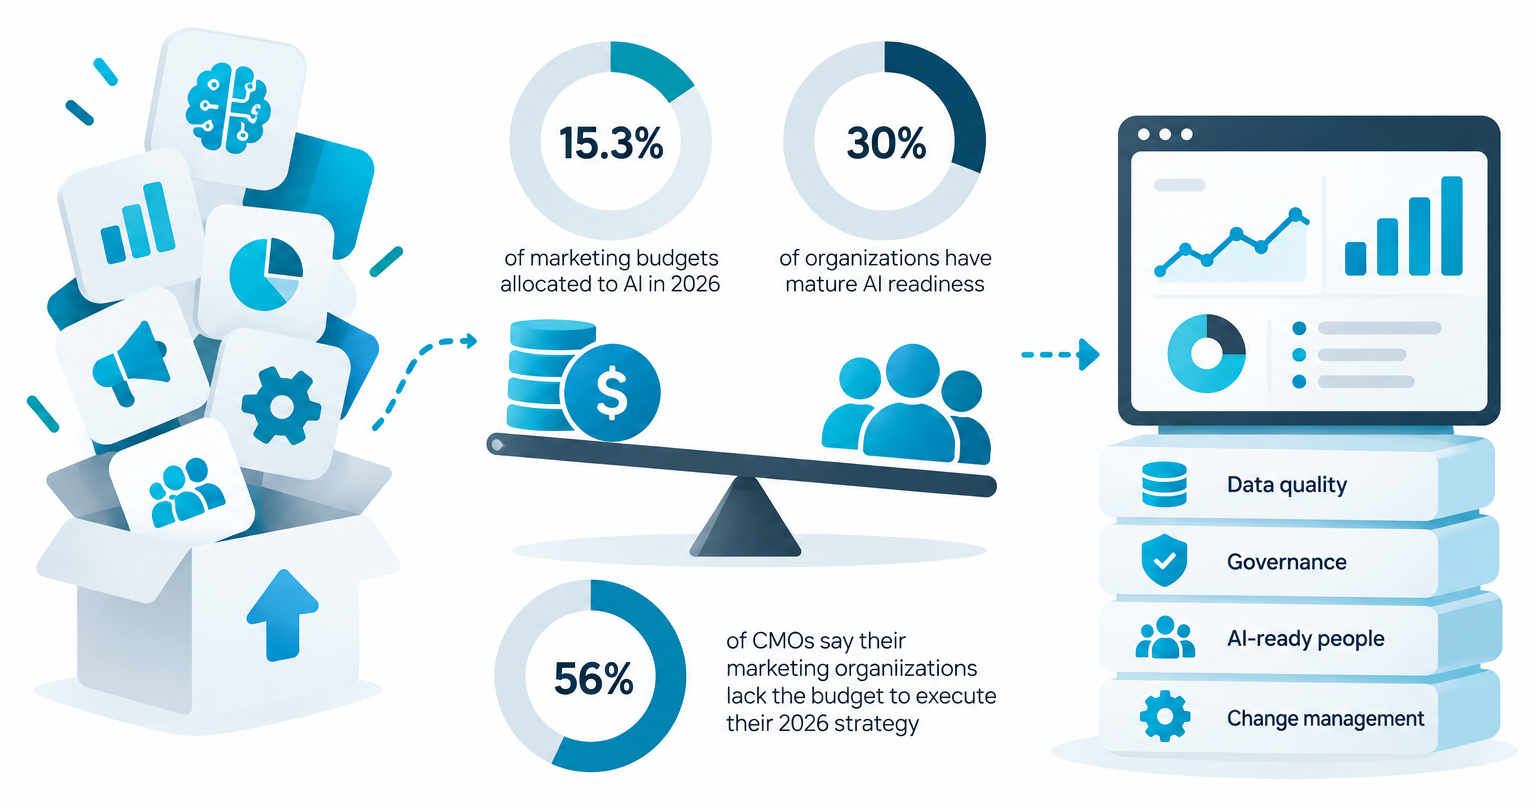
Gartner's research on AI initiatives makes the same foundation issue visible from another angle: organizations with successful AI initiatives were found to invest up to four times more, as a percentage of revenue, in areas such as data quality, governance, AI-ready people and change management.
For GA4, the lesson is practical. A dashboard should sit on top of a measurement framework rather than becoming a substitute for one.
The most useful GA4 dashboard is therefore not necessarily the one with the most charts. It is the one that helps a marketing leader move through a logical sequence. Performance changes. The dashboard makes the change visible. The next layer identifies where it happened. Campaign and acquisition data provide context. Conversion data shows whether the problem continues through the customer journey. Technical validation then determines whether the behavior represents a real business change or a measurement problem.
That sequence turns the dashboard into an investigation starting point. It also explains why the new GA4 functionality fits into a much larger evolution of analytics. Google is simultaneously improving campaign-data validation, introducing new diagnostics and expanding programmatic access to analytics data. The direction is clear even without assuming where every future feature will go: analytics is moving closer to continuous investigation rather than periodic reporting.
Consider a form submission key event. A dashboard may show fewer submissions, but the number alone does not explain the decline. An analyst can compare the event by device, landing page and campaign, then verify whether the submission event is firing correctly and whether its parameters are still being populated. If tracking is consistent but submissions are genuinely lower, the investigation can move back toward campaign performance, landing-page experience or demand. This is where a dashboard becomes more than a reporting layer. It provides the starting point for a structured investigation.
The strongest GA4 implementation starts with a deceptively simple question: which decisions should this dashboard help someone make? From there, the structure becomes easier to define. Business performance belongs beside the acquisition signals that explain it. Conversion metrics need the events and parameters that make the journey measurable. Diagnostic views need enough detail to distinguish a business problem from an implementation problem.
And when a number moves, there should already be a path to the next question. That is ultimately where GA4 Dashboards become interesting. Google has made it easier to bring KPIs together, customize visualizations and explore data from a single workspace. But the value does not come from arranging six different chart types on a page.
It comes from reducing the distance between Performance → Investigation → Decision.
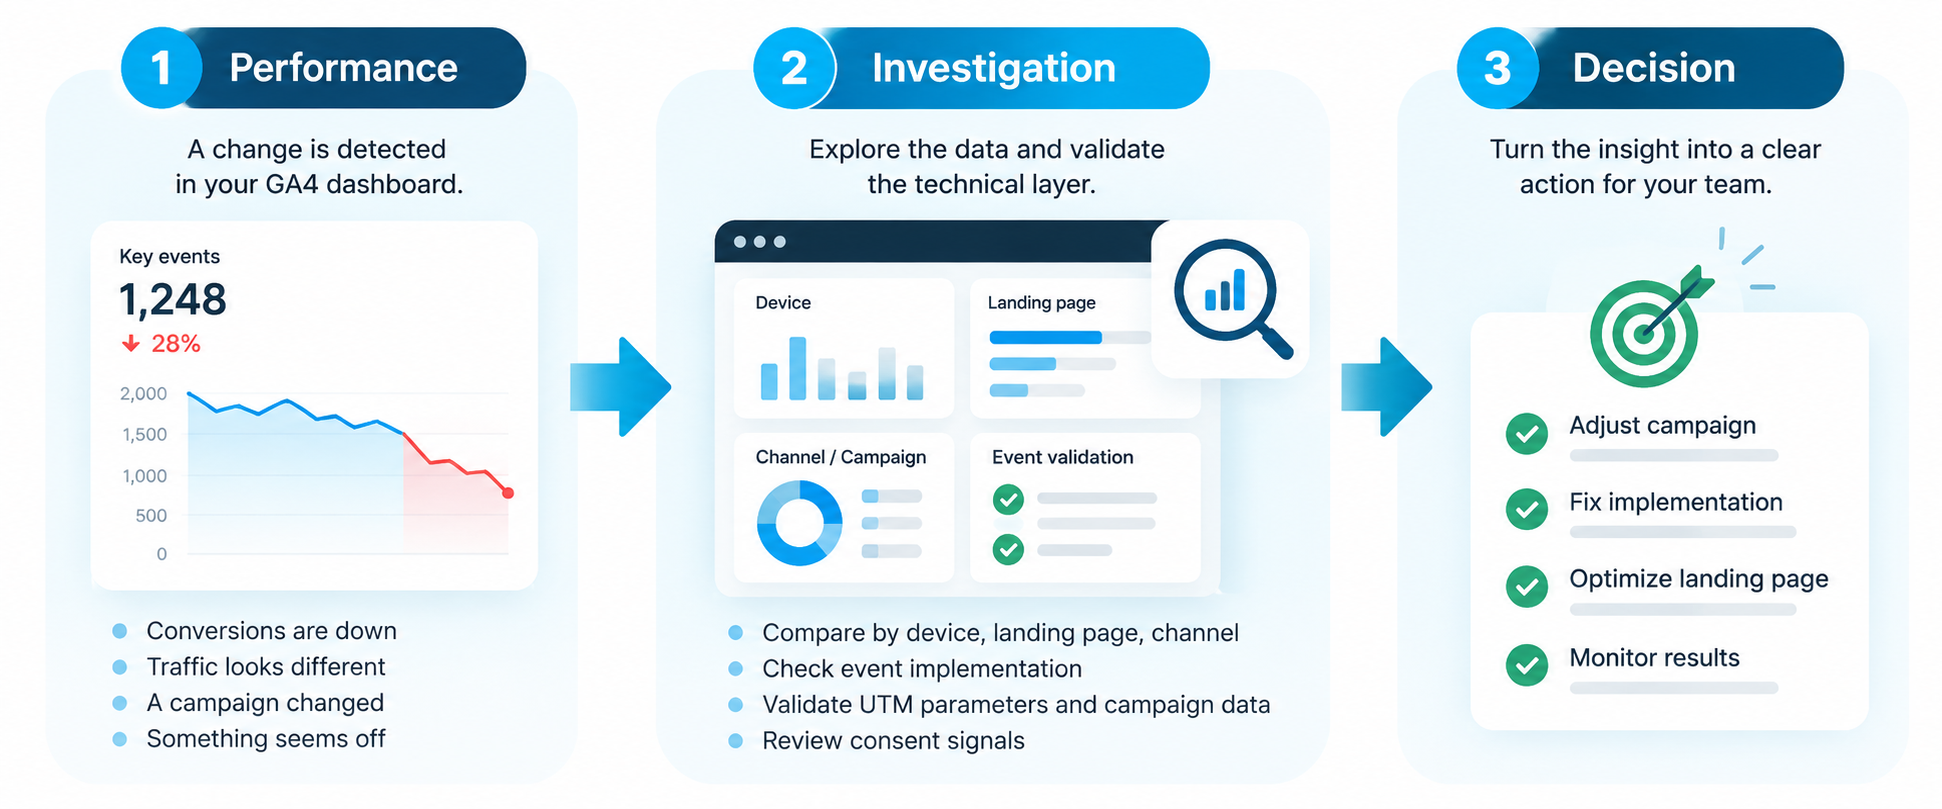
For organizations already investing in GA4, the next opportunity is therefore not simply to build another dashboard. It is to examine whether the measurement architecture underneath it can support faster, more reliable decisions across campaigns, conversion journeys, consent and MarTech. That is the difference between analytics that reports what happened and analytics that helps a marketing organization decide what to do next.
properties.chat